In a critical on-chain development, new data from analytics firm Glassnode reveals that Bitcoin’s price has dipped below the average cost basis of its short-term holders. According to the latest analysis, the aggregate cost bases for investors who acquired BTC within the last one and three months now stand at approximately $113,600 and $115,600, respectively. With the current market price trading below these levels, a significant portion of newer market participants are now holding their positions at a loss.
This on-chain metric is a crucial indicator for gauging near-term market sentiment and identifying potential areas of price resistance. Historically, when the market price falls below the cost basis of short-term holders (STHs), any subsequent rally can be met with selling pressure as these investors look to exit their positions at their breakeven point.
Understanding Short-Term Holder Cost Basis
The “Short-Term Holder Cost Basis” is a powerful on-chain metric that calculates the average price at which recent market entrants (typically those holding coins for less than 155 days) acquired their Bitcoin. It essentially represents the psychological “breakeven” price for this cohort of investors.
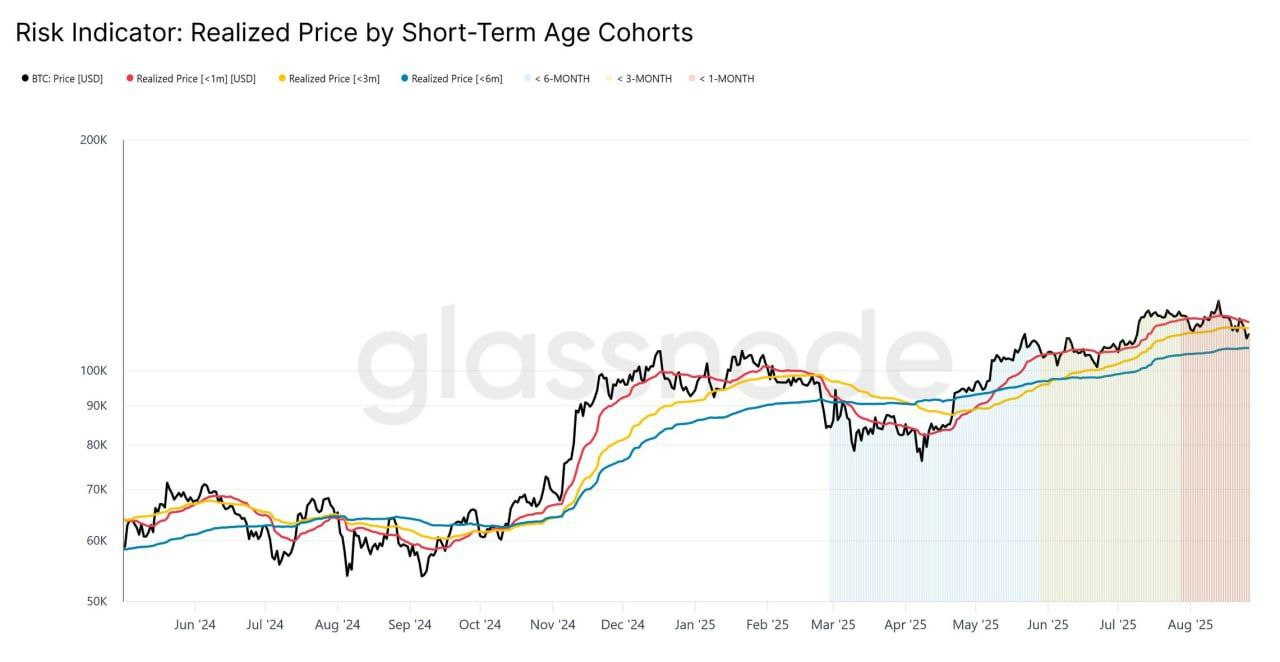
Glassnode’s data highlights two specific, and very recent, groups of these holders:
- 1-Month Cohort: Has an average cost basis of $113.6k.
- 3-Month Cohort: Has an average cost basis of $115.6k.
When the live Bitcoin price is above these levels, these holders are in profit and are more likely to hold onto their assets, anticipating further gains. However, when the price falls below their cost basis—as is the current situation—these investors are “underwater,” creating a state of unrealized loss and psychological stress.
Why This Creates Overhead Resistance
The primary implication of the current on-chain setup is the formation of significant overhead resistance for the Bitcoin price. Here’s the market psychology at play:
- Breakeven Mentality: Investors who bought in at higher prices and are now at a loss are often eager to sell if and when the price returns to their entry point. Their primary goal shifts from seeking profit to simply avoiding a loss.
- Sell-Side Pressure: As the Bitcoin price attempts to rally back towards the $113k-$116k range, it will encounter a wave of this “breakeven” selling. This creates a supply wall that can cap or slow down a price recovery. The more coins that were acquired in this price range, the stronger the potential resistance.
This dynamic is a classic example of how on-chain data can provide insights into market structure that are not visible on a standard price chart. It defines a clear zone where supply is likely to re-enter the market.
What to Watch For: A Test of Market Strength
For a bullish continuation, the market will need to demonstrate enough buying demand to absorb this anticipated sell-side pressure and decisively reclaim the levels above $116,000. A strong push through this zone would signal that the market has absorbed the “breakeven” sellers and could indicate a renewed confidence among investors, potentially flipping this resistance level into new support.
Conversely, if the price repeatedly fails to break above this resistance zone, it could suggest that short-term holder anxiety is high, potentially leading to a period of consolidation or a further price correction as buyers struggle to overcome the overhead supply.
In conclusion, the data from Glassnode offers a clear and actionable insight into the current state of the Bitcoin market. With short-term holders now underwater, the $113k-$116k price zone has become the key battleground. Traders and investors will be watching this on-chain level closely to gauge the market’s underlying strength and determine the next likely directional move for BTC.