What is a Heatmap?
A heatmap is a visual representation of data that helps traders analyze market dynamics quickly. The heatmap from Coinglass that you shared indicates liquidation levels and order book heat zones, which are crucial in understanding trader behavior and potential price movements in the crypto market.
Interpreting the Coinglass Heatmap
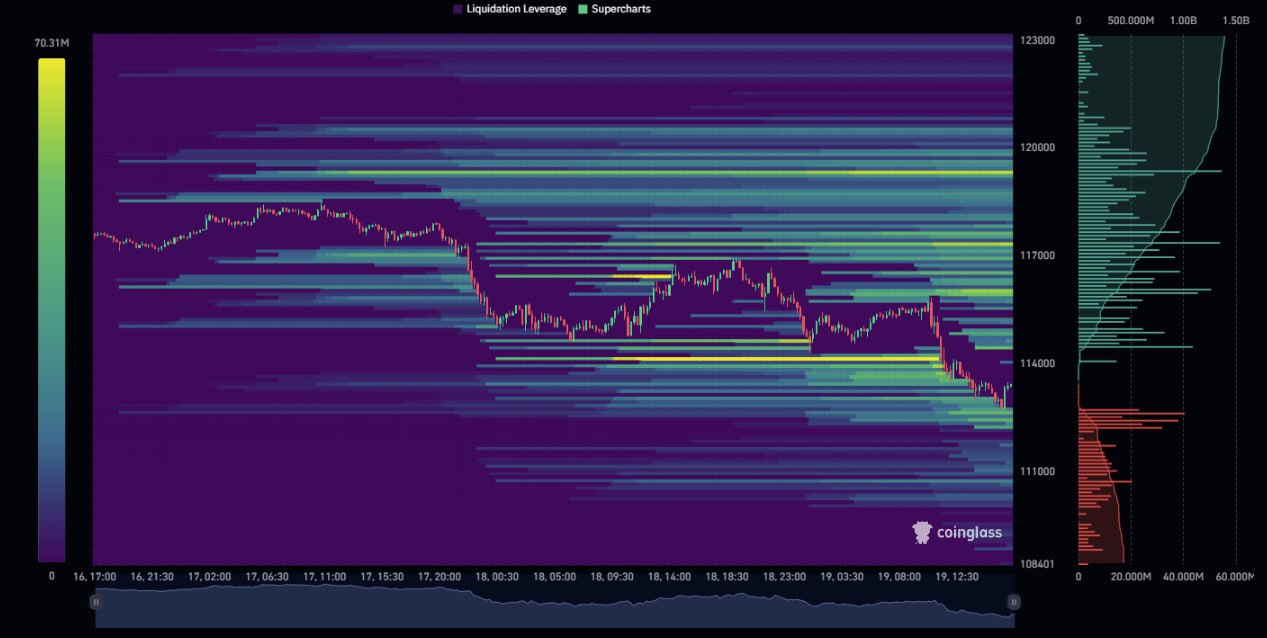
The Coinglass heatmap illustrates areas where significant liquidations are likely to occur. The brightly colored zones often represent concentrated trading activity, indicating when a large number of positions might get liquidated if price movements reach those thresholds. For traders, this provides insight into where the market may experience volatility and sharp price changes.
Using Heatmaps to Anticipate Market Moves
By analyzing the heatmap, traders can capitalize on impending shifts in market sentiment. For instance, if many liquidations cluster around a particular price point, it may signal that a substantial move could happen if the price approaches that level. Educated predictions can be made regarding potential support and resistance levels, better informing your trading strategies and risk management techniques.
In summary, using the Coinglass heatmap can enhance your trading decisions by highlighting critical market zones. Understanding its components allows for better anticipation of market moves, ultimately leading to more informed trading actions.